
The newly appointed Minister of Justice announced an elaborate plan to change the way the judicial system works. Since then, Israel has been experiencing one of the most serious crises in its history. Fear that the country is being stripped of its democratic nature has sent tens of thousands to demonstrate every week. With no end in sight, this deep crisis is threatening the delicate social balance of Israel’s society.
As in other places around the world, the debate over Israel's judicial system is full of inaccuracies and misconceptions. Facts are being twisted and misused to illustrate a skewed view of the political balance of power to justify the new reform. At times like these, graphic designers and information designers have a key role. We have the tools to make data accessible in a clear, visual form. Knowledge is power, and knowing the facts can illuminate the extent of the present transformation.
This project confronts key assumptions underlying the reform. The first series deals with the assumption that the Supreme Court intervenes too often in the lawmaking process by overturning laws. Three graphs illustrate, firstly, how many laws were overturned on average over the years; secondly, what was the given cause for the ruling, i.e. what values did the laws violate; and thirdly, the frequency of overturning laws in Israel in comparison to other countries.

Since 1995, the Supreme Court overturned laws in 22 cases. 22 cases in 28 years.
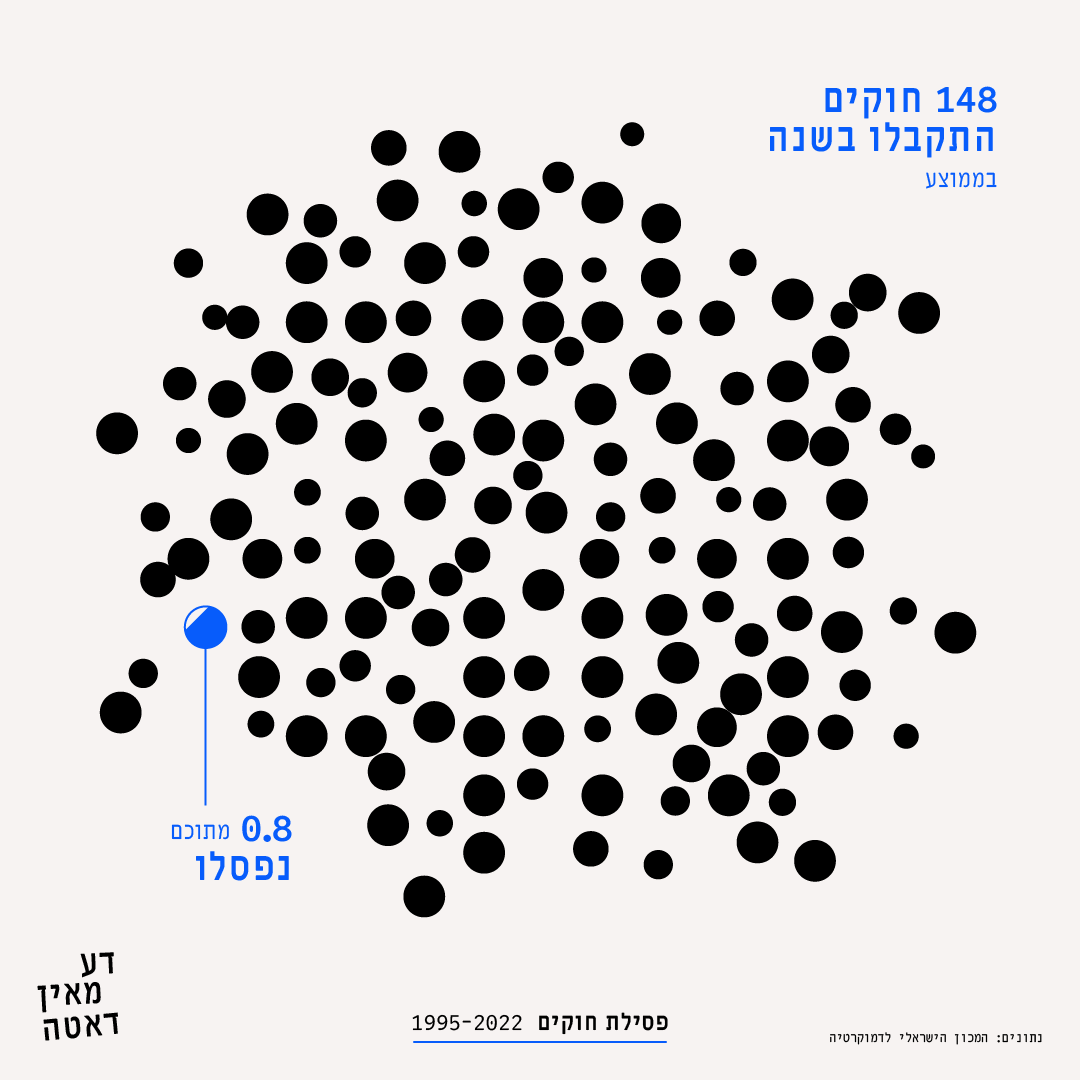
Overturning Laws 1995-2022: 148 laws pass in a year on average, 0.8 of them were overturned

Overturning Laws 1995-2022: What was the given cause for the ruling
Top to bottom: The right to life and the integrity of the body | The right to respect | Freedom of vocation | Equality | The right to freedom | Disproportionality | The right to property | Freedom of expression | The right to a fair trial | A flaw in the legislative process
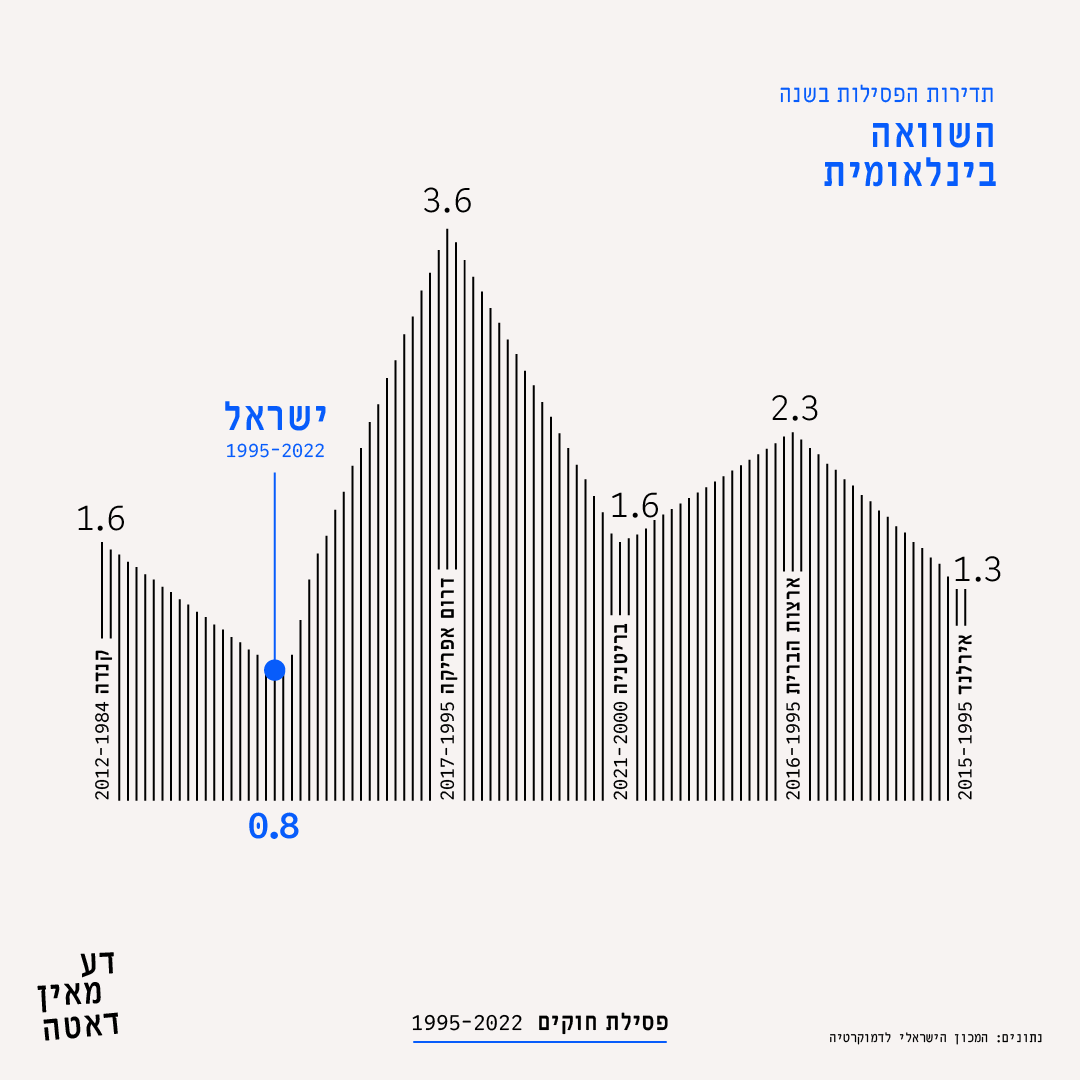
Overturning Laws 1995-2022: The frequency of overturning laws in Israel in comparison to other countries
Left to right: Canada 1984-2012 - 1.6 | Israel 1995-2022 - 0.8 | South Africa 1995-2017 - 3.6 | Britain 2000-2021 - 1.6 | USA 1995-2016 - 2.3 | Ireland 1995-2015 - 1.3

"Choosing judges must be based, first and foremost, on the professional level and personal ability of the candidates. However, when the professional level and personal ability are appropriate, weight must also be given to the principle of reflecting society." The Committee for the Election Procedures of Judges, 2001
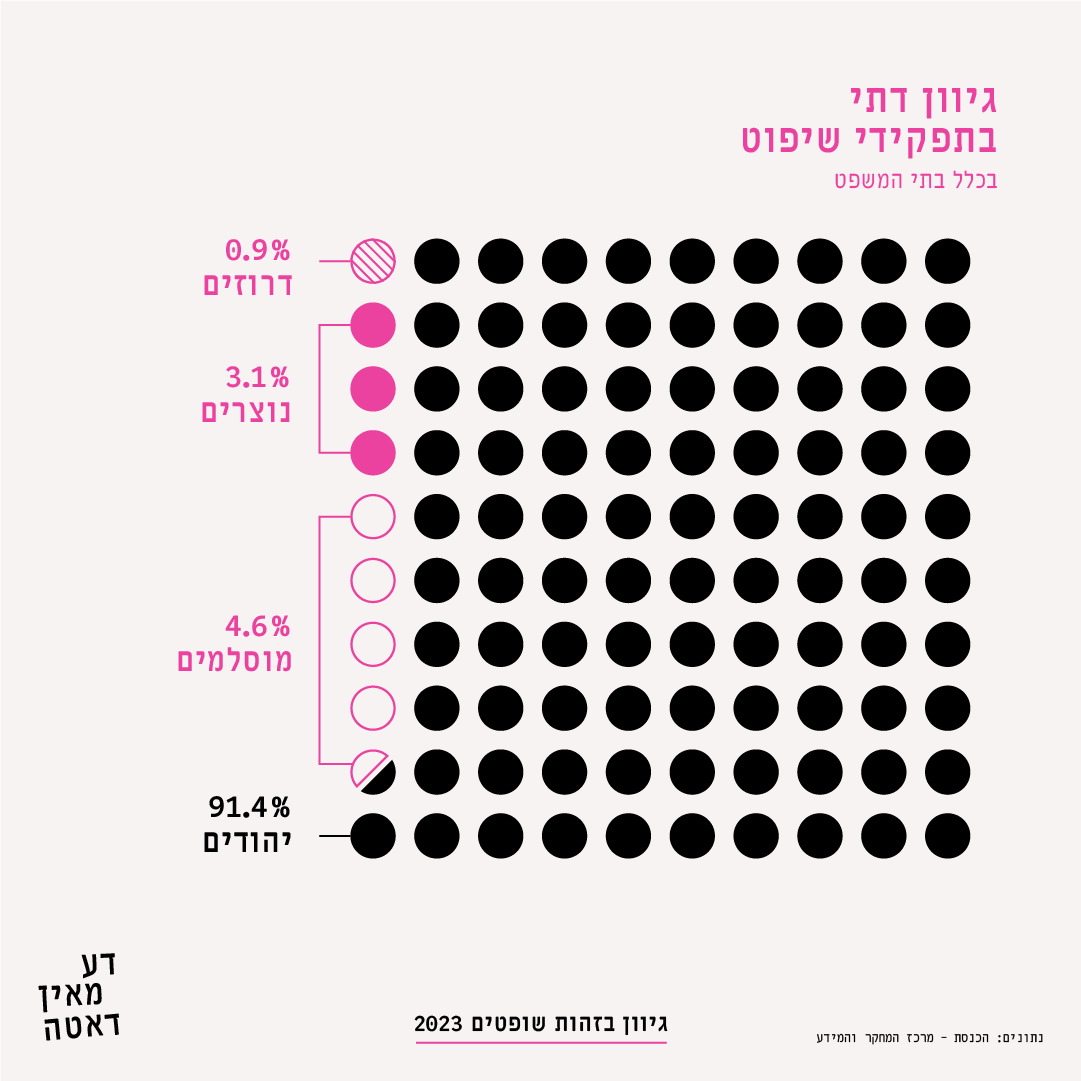
Diversity of Judges 2023: Religious diversity in judicial positions, in all courts
Top to bottom: 0.9% Druze | 3.1% Christians | 4.6% Muslims | 91.4% Jews
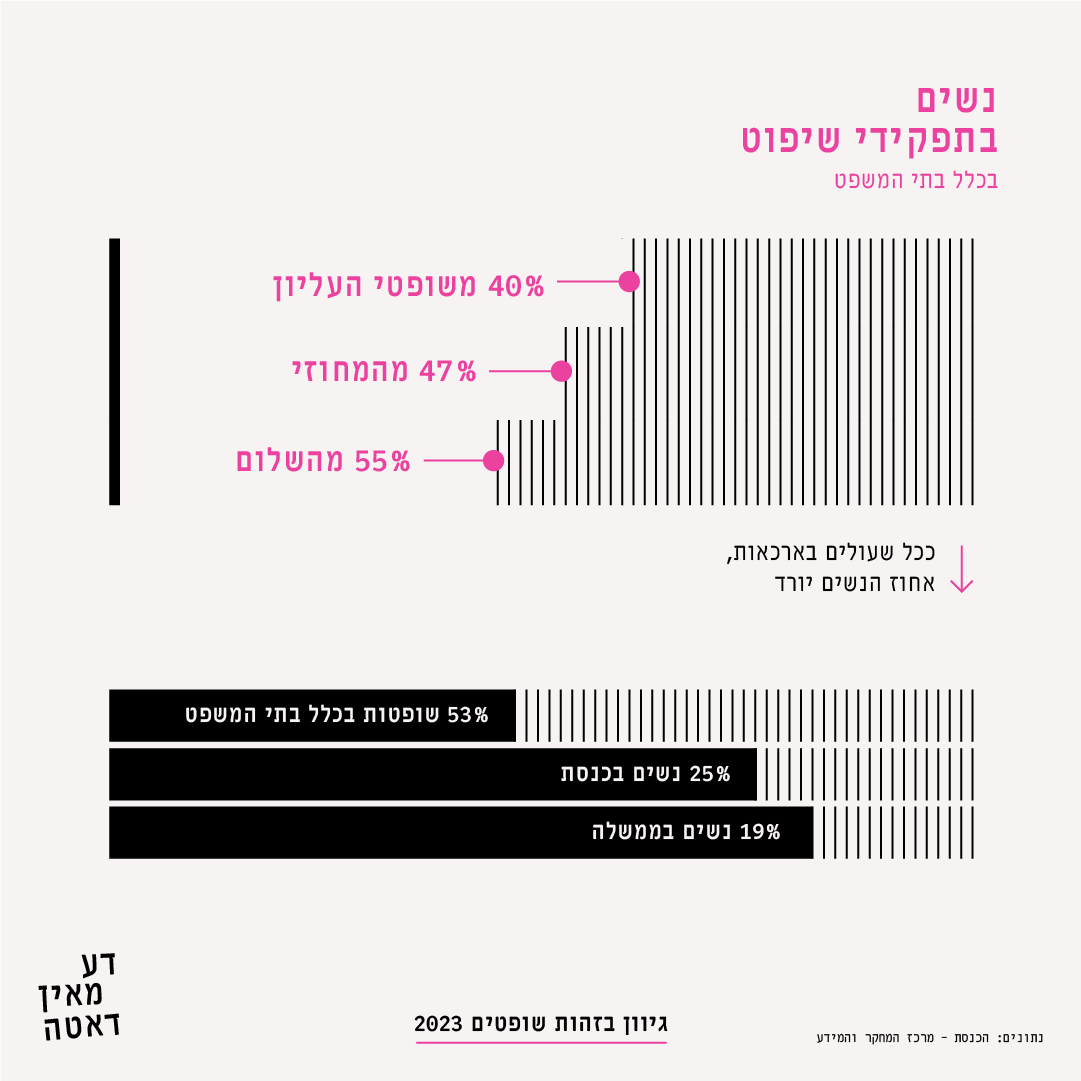
Diversity of Judges 2023: Women in judicial positions in all courts
Top graph: Women are 40% of the Supreme Court judges | 47% of district court judges | 55% of lower court judges
Bottom graph: Women are 53% of judges in all courts | 25% of the Knesset | 19% of the government
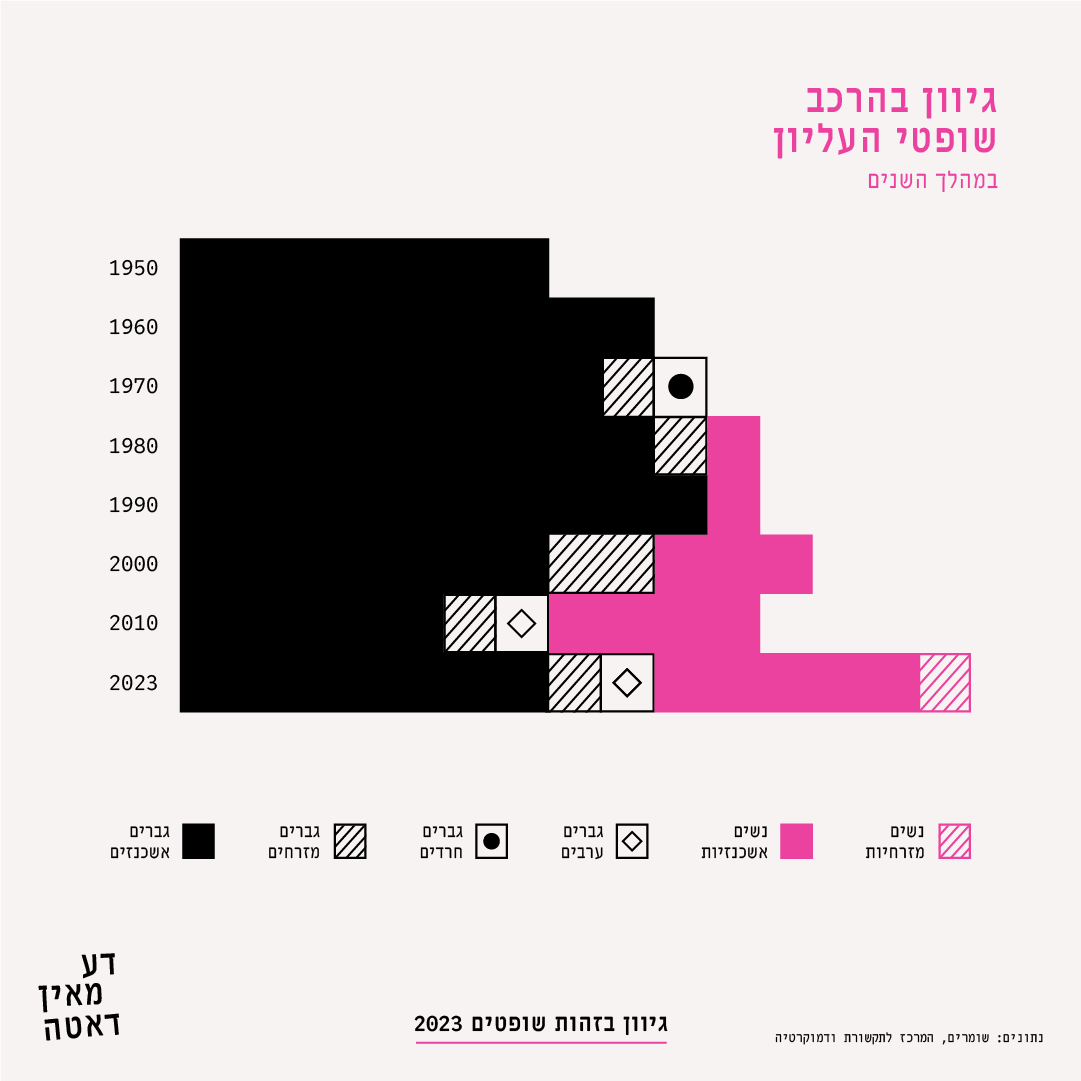
Diversity of Judges 2023: Diversity in the composition of Supreme Court judges
Legend left to right: Ashkenazi men | Mizrahi men | Ultra-Orthodox men | Arab men | Ashkenazi women | Mizrahi women